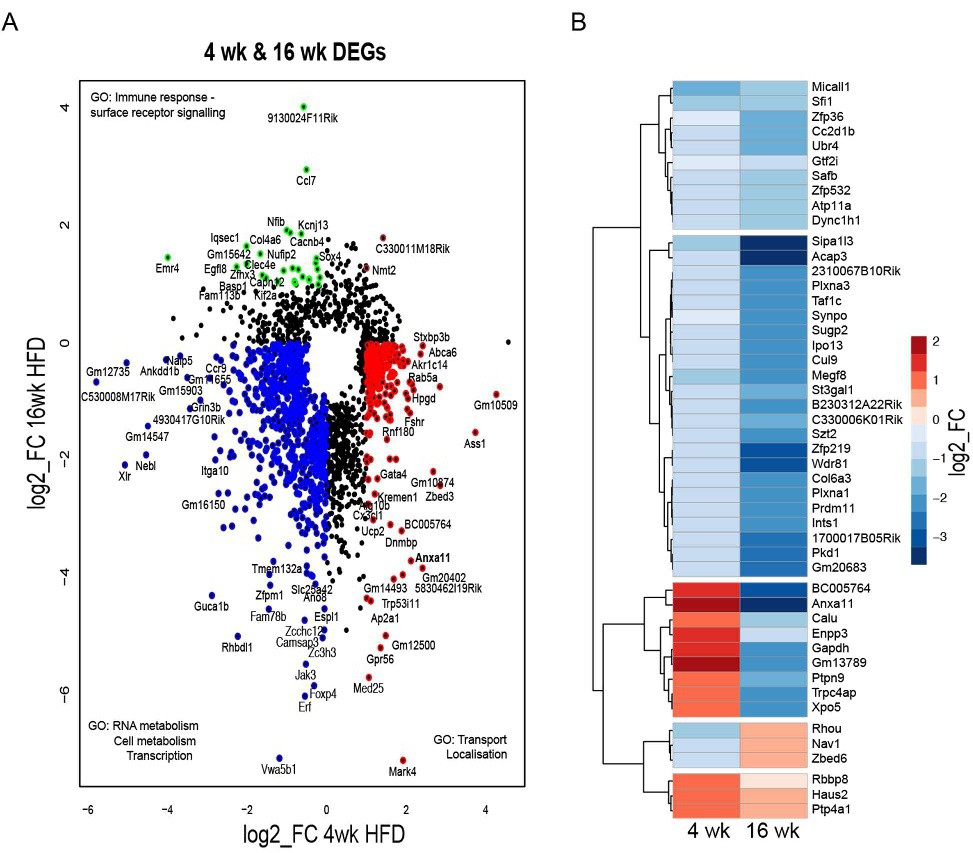
Fig. 3. Temporal changes in the transcriptome of cumulus cells during obesity progression. DESeq2 analysis of transcriptome data in cumulus cells (CC) of mice fed high fat diet (HFD) for 4 or 16 weeks (wk). N= 3-7 mice per group. (A) Scatter plot presents genes differentially expressed in at least one condition (false discovery rate <0.05) in CC after 4 wk (997 genes) or 16 wk HFD (846 genes). Genes coloured blue are downregulated after both 4 wk and 16 wk HFD; green downregulated after 4 wk HFD and upregulated after 16 wk HFD; brown upregulated after both 4 wk HFD and after 16 wk; red upregulated after 4 wk HFD and downregulated after 16 wk HFD. (B) Heatmap presents hierarchical clustering of genes significantly changed in both 4 and 16 wk HFD normalised by average control fed chow diet. Genes cluster in group downregulated after 4 wk and 16 wk HFD, group upregulated after 4 wk and downregulated after 16 wk HFD, group downregulated after 4 wk and upregulated after 16 wk HFD and group upregulated after both 4 wk and 16 wk HFD. Gene ontology analysis performed with Gene Ontology Enrichment Analysis and Visualisation Tool. log2_FC of reads per million (RPM).